
The solubility of a gas in a liquid increases with increasing pressure. To understand this at the molecular level, imagine the following equilibrium established in a closed container fitted with a movable piston.If the piston is pushed down (Figure 13.11b), the gas is compressed and its pressure increases. This causes the concentration of the gas molecules over the solution to increase, so the rate at which the gas dissolves is now greater than the rate at which it leaves the solution. Eventually, equilibrium is reestablished when the concentration of the gas in the solution has increased enough to make the rate of escape equal to the rate at which the gas dissolves (Figure 13.11c). At this point, the concentration of the gas in the solution is higher than before.
Adapted from Chemistry the Molecular Nature of Matter 6th Ed. by Jesperson, Brady and Hyslop. © 2000-2012, pages 595-597
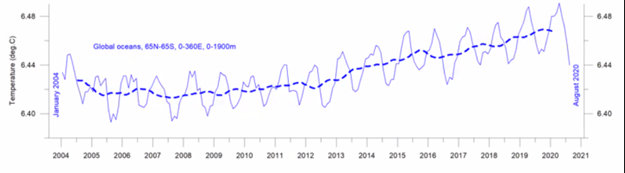
The graphic above illustrates mixed gases in the volume of a closed container. Work is done to compress the volume which increases the total pressure and temperature of all the gas molecules in that volume, which in turn increases the absorption of each of those molecules in the liquid. In the open atmosphere, when a gas such as CO2 is added, then the volume of the atmosphere increases but the total pressure and temperature of the atmosphere do not increase. Usually, when CO2 is added, O2 has been removed, so the volume change is negligible; but the ratio of the number of CO2 molecules with respect to the O2, N2, H2O and other atmospheric gas molecules changes. That is, the partial pressure of CO2 increases relative to the other atmospheric gas molecules. Similar to Figure 13.11, when the partial pressure of CO2 increases, then the rate of collision of CO2 molecules with all surfaces increases relative to the other gas molecules since there are numerically more of them. The absorbance of CO2 molecules into all liquid surfaces increases relative to the other gas molecules. And also absorbance of CO2 molecules into liquid surfaces increases relative to the emission of CO2 molecules from liquid surfaces. In the natural environment, absorption of gases into liquids surfaces and emission of gases from liquid surfaces are happening simultaneously and continuously. Note that the surface is dominantly the surface of sea water in the ocean, about 71% of earth’s surface, but also the surface of lakes, rivers, and water in soil, water in leaf tissue, water in lung tissue, raindrops, and bubbles. Existentially important for all life on earth, CO2 is plant food, absolutely necessary for all green plants for their use in photosynthesis in their cells by sunlight to grow the carbohydrate structure and cells of the plant. The only way CO2 enters plants is by absorption of CO2 from air into water in the plant’s tissues. Oxygen emitted to the air is a by-product of the plant’s photosynthesis of CO2. Not only are plants on land and in ocean feeding all animal life, but they are also providing oxygen for animals to breath. In other words, efforts by so-called environmentalists and proponents of Net Zero and Climate Crisis to reduce CO2 are a planetary suicide pact. The ONLY way CO2 gets into plants to feed them is by absorption of CO2 from the air. Henry’s Law defines the ratio of (1) a gas absorbed into liquid surfaces versus (2) the same gas emitted from that surface. As previously discussed here, the ratio (or coefficient) of absorption to emission is an inverse function of the temperature of the surface interface between the liquid and the gas. In other words, cold surfaces absorb more gas than warm surfaces. This inverse function is true for all natural gases and liquids. Warm liquid surfaces emit more gas than cold liquid surfaces. The coefficient or ratio of absorption versus emission is known as the Henry’s Law constant kH which is dependent on temperature. A kH is not a function of nor dependent on the source of the gas nor on the amount of the gas. A kH is an intensive property of matter, like a boiling point or specific heat. There is a unique kH for each combination of a liquid solvent and a gas solute. Thus kH for seawater and oxygen is different than kH for seawater and CO2. But absorption of both oxygen and carbon dioxide increase as the temperature of the surface decreases, and vice-versa. Warmer ocean surface causes larger numbers of CO2 gas molecules (and all other gas molecules) to be emitted to air compared to the number of CO2 gas molecules (and all other gas molecules) colliding with ocean surface and being absorbed into the ocean water. Since the temperature of the ocean surface is changing continuously by various causes including day/night, clouds, seasons, air and ocean currents, convection, wind, waves, etc, no static equilibrium condition exists; Henry’s Law defines dynamic equilibriums in the real world. The probable reason for the slowly increasing trend in net global CO2 concentration (e.g., the Keeling Curve) is not CO2 emissions by humans burning fossil fuels but is instead the slowly increasing trend in sea surface temperature, as shown in the following graphic presented by Ole Humlum in his Dec 7, 2020 lecture to CLINTEL ICSF.
This short video illustrates the different relative solubilities of gases in water.
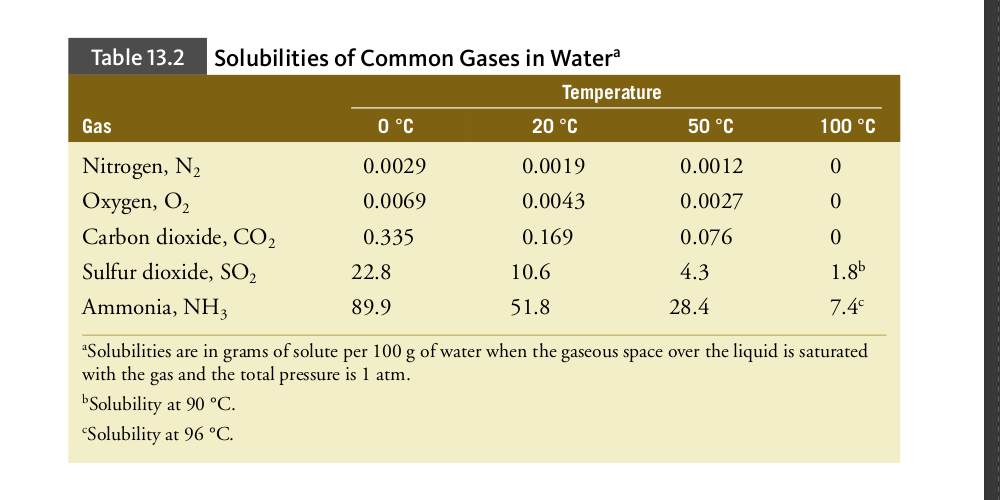
Using Henry’s Law we can calculate the concentration of any known gas in any known liquid at any known temperature if we measure the concentration or the partial pressure of the gas above the liquid. The gas measurement in the gas matrix is much more accurate and reproducible than the gas measurement in the liquid matrix. For example, we can calculate the concentration of nitrogen gas (N2) in water at 25 degrees C. We measure or look up in a textbook that N2 is 78.08% of air by volume. Thus the partial pressure of nitrogen in air by volume is 0.7808 = pN2. We also find in a textbook or online software that the Henry’s Law constant for N2 in water is 6.48 X 10⁻⁴. The Henry’s Law equation arranged for partial pressure is at 25 C,
kH = cN2aqueous / pN2
where kH is the Henry’s Law constant for N2 gas solute in water solvent = 6.48 X 10⁻⁴
cN2aqueous is the concentration of the N2 gas which is dissolved in the water, which is our unknown in this example.
pN2 is the partial pressure on N2 gas in the air above the water = 0.7808
this simple algebra: cN2aqueous = kH X pN2 = 6.48 X 10-4 X 0.7808
Thus cN2aqueous (i.e., the concentration of N2 gas in water at 25 C) = 5.06 X 10⁻⁴ moles of N2 gas per liter of water. Conveniently, there are several different derivations of the Henry’s Law equation for different purposes. The U.S. National Oceanographic and Atmospheric Administration (NOAA) lab and Scripps Oceanographic Institute (Scripps) co-manage a set of laboratories around the globe called the Global Monitoring Laboratories (GML) which measure net CO2 in air as well as other gases in air. The NOAA-Scripps GML lab at Mauna Loa, Hawaii is generally accepted as the defacto gold standard for comparison to other labs. The NOAA-Scripps GML lab at Mauna Loa has for many decades measured CO2 in air by molar mass in dried air rather than by volume; the GML labs report CO2 as micromoles of CO2 per moles of air, which is equivalent to parts per million (ppm), not ppmv. Thus the dimensionless version of kH is most convenient for atmospheric gases. The version of the Henry’s Law equation for molar mass for a given temperature of the liquid surface is: kH = caq / cgve where:
caq = concentration by molar mass of the gas dissolved in the liquid cg = concentration by molar mass of the gas in air above the liquid caq / cg = caq divided by cg the resulting kH is dimensionless or unitless since the units are cancelled out in the division arithmetic. Now we can look up the dimensionless version of kH for CO2 in water at a given temperature of ocean surface and use this along with the Mauna Loa-measured net CO2 in ppm to calculate the CO2 in water. Thus units in our calculation formula match units for gold standard CO2 measurements, avoiding the difficult conversion of ppmv volume units of air which contain continuously varying amounts of water vapor to the gold standard measured units of ppm molar mass in dry air reported by the GML. It is important to point out that these labs do not measure human CO2 emissions, nor could they do so with acceptable accuracy and reproducibility. These labs measure net CO2, which is total CO2 emissions by all sources (natural and human) minus total CO2 absorptions by all sinks (natural and human). This is rarely pointed out to the public, which, due to this omission, the general public is allowed to erroneously believe that the famous Keeling Curve (example below) shows the growth in human CO2 emissions.
 Dimensionless kH values can be found here Sander (2023): https://acp.copernicus.org/articles/23/10901/2023/ or in the attached pdf Sander (1999). Sander presents theoretical background, tabular constants, conversion factors between the various version of kH and the derivation of Henry’s Law for its temperature dependence, as well as copious references.
It is worthwhile to mention that these results are consistent with peer reviewed published results of well executed experiments. Here is an abstract of one example, work reviewed by Charles Keeling founder of the GML lab at Mauna Loa (pdf).
“Associations between the sea-surface temperature (SST) in the eastern equatorial Pacific (0°-10°s, 1800-80°W) and changes in atmospheric CO2 concentration have been examined. The CO2 records at Mauna Loa and the South Pole of the Scripps Institution of Oceanography, and the shorter records of the Geophysical Monitoring for Climatic Change program at Barrow, Samoa, the South Pole and Mauna Loa, were used after the annual cycles and the growth due to fossil fuel emissions had been removed. We find that warmer than average SST precedes above-average increases in CO2 by about one season at Mauna Loa and two seasons at the South Pole. The shorter records at Samoa and Barrow support longer lags – 2 to 3 seasons at Samoa and 3 to 5 seasons at Barrow. The correlations and their lags change with time, however, there being periods of relatively high correlation associated with El Nino events and periods of lower correlation when El Nino is not present. Furthermore, there is a seasonal preference for these high correlations. At Mauna Loa, the change of CO2 from (NH) fall to spring is better correlated with antecedent SST than the changes from spring to fall. At the South Pole, a similar pattern is found with a one-season shift.”
William P. Elliott & James K. Angell (1987) On the relation between atmospheric CO2 and equatorial sea-surface temperature, Tellus B: Chemical and Physical Meteorology, 39:1-2, 171-183, DOI: 10.3402/tellusb.v39i1-2.15335 To link to this article: https://doi.org/10.3402/tellusb.v39i1-2.15335
Dimensionless kH values can be found here Sander (2023): https://acp.copernicus.org/articles/23/10901/2023/ or in the attached pdf Sander (1999). Sander presents theoretical background, tabular constants, conversion factors between the various version of kH and the derivation of Henry’s Law for its temperature dependence, as well as copious references.
It is worthwhile to mention that these results are consistent with peer reviewed published results of well executed experiments. Here is an abstract of one example, work reviewed by Charles Keeling founder of the GML lab at Mauna Loa (pdf).
“Associations between the sea-surface temperature (SST) in the eastern equatorial Pacific (0°-10°s, 1800-80°W) and changes in atmospheric CO2 concentration have been examined. The CO2 records at Mauna Loa and the South Pole of the Scripps Institution of Oceanography, and the shorter records of the Geophysical Monitoring for Climatic Change program at Barrow, Samoa, the South Pole and Mauna Loa, were used after the annual cycles and the growth due to fossil fuel emissions had been removed. We find that warmer than average SST precedes above-average increases in CO2 by about one season at Mauna Loa and two seasons at the South Pole. The shorter records at Samoa and Barrow support longer lags – 2 to 3 seasons at Samoa and 3 to 5 seasons at Barrow. The correlations and their lags change with time, however, there being periods of relatively high correlation associated with El Nino events and periods of lower correlation when El Nino is not present. Furthermore, there is a seasonal preference for these high correlations. At Mauna Loa, the change of CO2 from (NH) fall to spring is better correlated with antecedent SST than the changes from spring to fall. At the South Pole, a similar pattern is found with a one-season shift.”
William P. Elliott & James K. Angell (1987) On the relation between atmospheric CO2 and equatorial sea-surface temperature, Tellus B: Chemical and Physical Meteorology, 39:1-2, 171-183, DOI: 10.3402/tellusb.v39i1-2.15335 To link to this article: https://doi.org/10.3402/tellusb.v39i1-2.15335
The effect of pressure on the solubility of a gas can also be explained by Le Châtelier’s principle. In this case, the disturbance is an increase in the pressure of the gas above the solution. How could the system counteract the pressure increase? The answer is: by having more gas dissolve in the solution. In this way, the pressure of the gas is reduced and the concentration of the gas in the solution is increased. In other words, increasing the pressure of the gas will cause the gas to become more soluble. Figure 13.12 shows how the solubility in water of oxygen and nitrogen vary with pressure. The straight lines on the graph indicate that the concentration of the gas is directly proportional to its pressure above the solution. This is expressed quantitatively by Henry’s law, which states that the concentration of a gas in a liquid at any given temperature is directly proportional to the partial pressure of the gas over the solution. Cgas = kHPgas (T is constant) (13.4) where Cgas is the concentration of the gas and Pgas is the partial pressure of the gas above the solution. The proportionality constant, kH, called the Henry’s law constant, is unique to each gas. The equation is an approximation that works best at low concentrations and pressures and for gases that do not react with the solvent.
An alternate (and commonly used) form of Henry’s law is(13.15) where the subscripts 1 and 2 refer to initial and final conditions, respectively. By taking the ratio, the Henry’s law constant cancels. Adapted from Chemistry the Molecular Nature of Matter 6th Ed. by Jesperson, Brady and Hyslop. © 2000-2012, pages 595-597

Seventy one percent of the Earth’s surface is water-covered. The oceans hold about 96.5 percent of all Earth’s water. Water also exists in the air as water vapor, in rivers, lakes, icecaps, and glaciers, in the ground as soil moisture, aquifers, and in all living organisms. There are winds and ocean currents and the mass transfer coefficients between the atmosphere and oceans are extremely varied, numerous and chaotic. Ocean cycles go to great depths and have cycle periods of hundreds of years. The surface of the sea may be calm, wavy, or frothy with bubbles forming foam and sprays of droplets, and even ice. All of these impact the mass transfer coefficients. But all these are independent from the partial pressure differential of CO2 between the atmosphere and the biosphere’s many sectors which is controlled solely by Henry’s Law and its variables; principally the water surface temperature at any air water surface boundary.